


Our Future, Together
Immigrants & the American economy
Immigrants and their children will grow our future economy more than any other group.
Learn more in a short video.

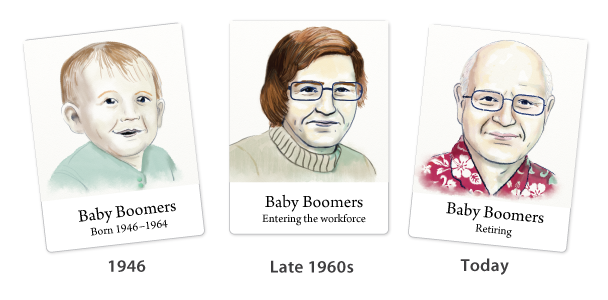
Who will replace the Baby Boomers?
Just as explorers use a compass and architects a blueprint, demographers use pyramid charts to read the tea leaves: What groups are aging or booming with youth , and what do these shapes tell us about the changing American workforce? Baby Boomers, the largest generation of Americans, will continue to retire in unprecedented numbers, and today, one in four young people are from immigrant families. By 2030, immigrants and their children will play a big part in reshaping our workforce and filling the roles left by the Boomers.
The interactive tool below allows you to explore the changes in workforce distribution of various generations and racial or ethnic groups between 1990 and 2030. The maturity of a group decides its shape. Play through the “Key Groups” to see an animation of the biggest shifts currently taking place.
Select categories to explore workforce-group snapshots.
Source: 2013 Pitkin-Myers projections and estimates.
See our entire workforce.
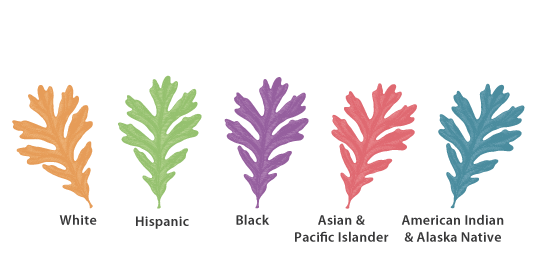
How do different demographics shape the workforce? While pyramid charts illustrate the shape of different groups, tree maps provide the ability to compare and contrast different groups alongside one another. As our workforce is changing, so too is the diversity in the racial and ethnic makeup of the country, with important implications for our future. As the Baby Boomers reach retirement age, our future economy will depend on the contributions of many more Hispanics and Asians than in the past.
The interactive tool below allows you to explore the growth of distinct racial and ethnic groups, as well as the overall generational and gender distribution of our workforce. Choosing an optional second category will provide a more detailed look at the changing contributions of these groups in the makeup of the future American workforce.
Choose a main category and a year to explore our workforce. Select an optional second category to look deeper.
Source: 2013 Pitkin-Myers projections and estimates.

Explore emerging trends, 1990-2030
The most striking change in the American workforce is the rise of the second generation—the children of immigrants. In 20 years, they will account for the majority of our workforce growth. As the aging of America continues, the economy will increasingly rely on a younger and more diverse generation to strengthen our workforce. Line charts are an ideal way to view emerging trends over time.
The interactive tool below allows you to explore trends of different groups, providing actual percentage points in the share of the total workforce and actual numbers in population. Selecting the optional orange line will give you an opportunity for enhanced interaction with the data and provide you a chance to compare the original selection with another group’s rate of change.
Select and combine categories to track the rate of change in workforce participation.
Source: 2013 Pitkin-Myers projections and estimates.

It's a familiar story.
Throughout our history, a steady stream of hardworking and talented people from all over the world has enriched the United States. These generations of Americans have helped make our country the engine of the global economy. With each new decade, newcomers come to our shores to strengthen our economy, build our communities, spur innovation, and continually reinforce our history as a nation of immigrants.
The interactive tool below allows you to explore the ebb and flow of legal immigration over the past almost 200 years. Selecting a specific region will reveal a deeper country-level view of the data, while hovering your mouse over the graphic reveals important historical legislative milestones.
Select a region, explore countries within, and investigate key historical events and legislation.
Sources: Historical Statistics of the United States: Millennial Edition Online, 2004–2012 Yearbook of Immigration Statistics